·5 min read
Aeroza: weather, but queryable
Introducing Aeroza, a developer-first weather platform for live radar, NWS alerts, geospatial queries, nowcasting, and public forecast verification.
When I was in second grade, I did a talent show act with my little sister where we gave the weather forecast to my elementary school.
Not a song. Not a magic trick. A forecast.
I remember being completely serious about it, in the way only a second grader with a hobby can be. Weather maps, temperatures, what was coming next, the whole thing. I was a weather nerd early, and apparently I did not see any reason to keep that private.
That habit never really left. I still check radar like some people check box scores. I still want to know where the line of storms is, how fast it is moving, whether the warning polygon makes sense, and what changed in the last ten minutes. The difference now is that my background gives me a much better toolbox for the obsession: statistics, computer science, geospatial data, APIs, model evaluation, and the deep satisfaction of turning a messy real-world signal into something you can query.
So I built Aeroza.
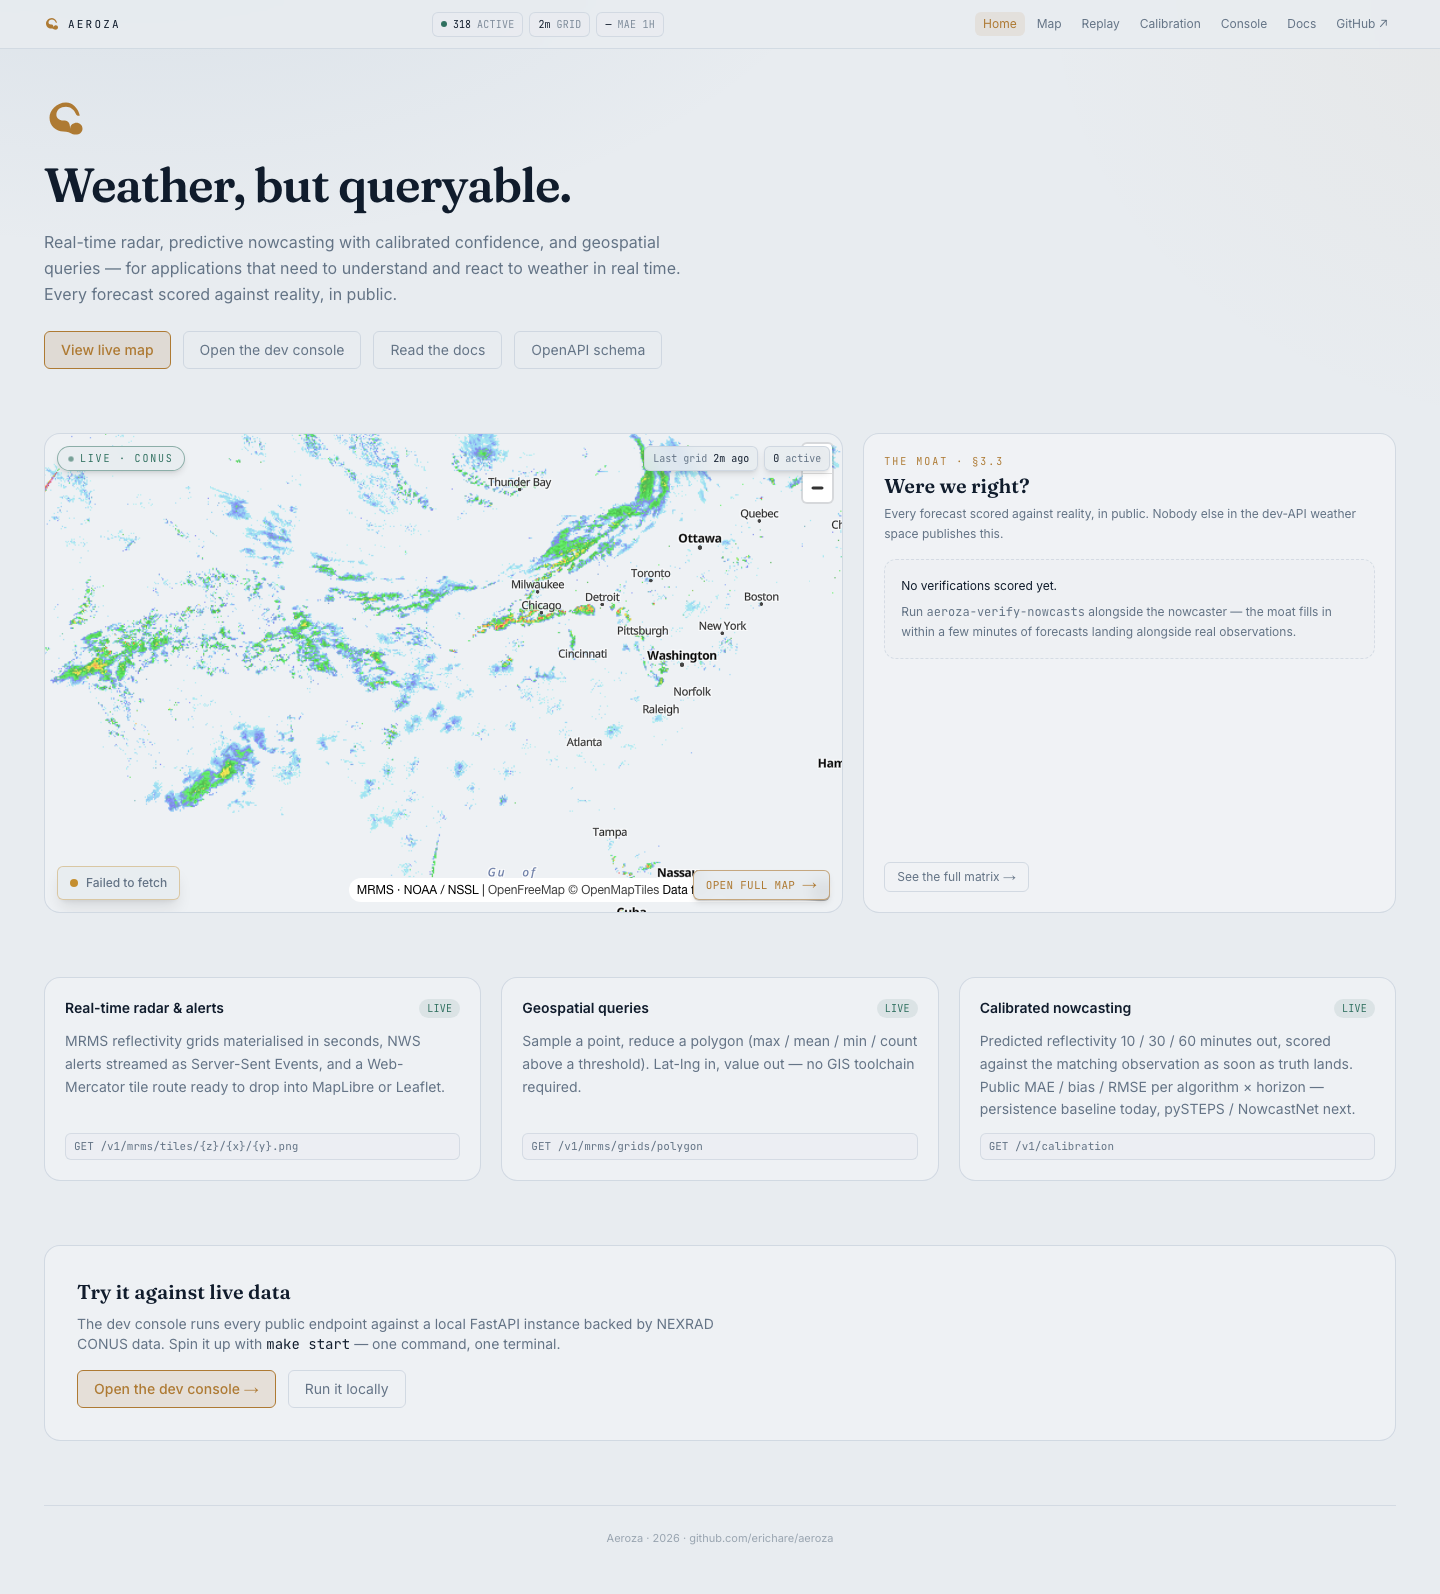
Aeroza is a developer-first weather platform. The short version is: weather, but queryable.
It pulls together real-time radar, NWS alerts, surface observations, geospatial queries, predictive nowcasting, and public verification metrics behind an API and a web console. It is not trying to be yet another pretty weather app for deciding whether to bring a jacket. It is more like weather infrastructure for applications that need to react to conditions as they change.
The shape of it
The first screen is intentionally direct: live map, developer console, docs, OpenAPI schema.
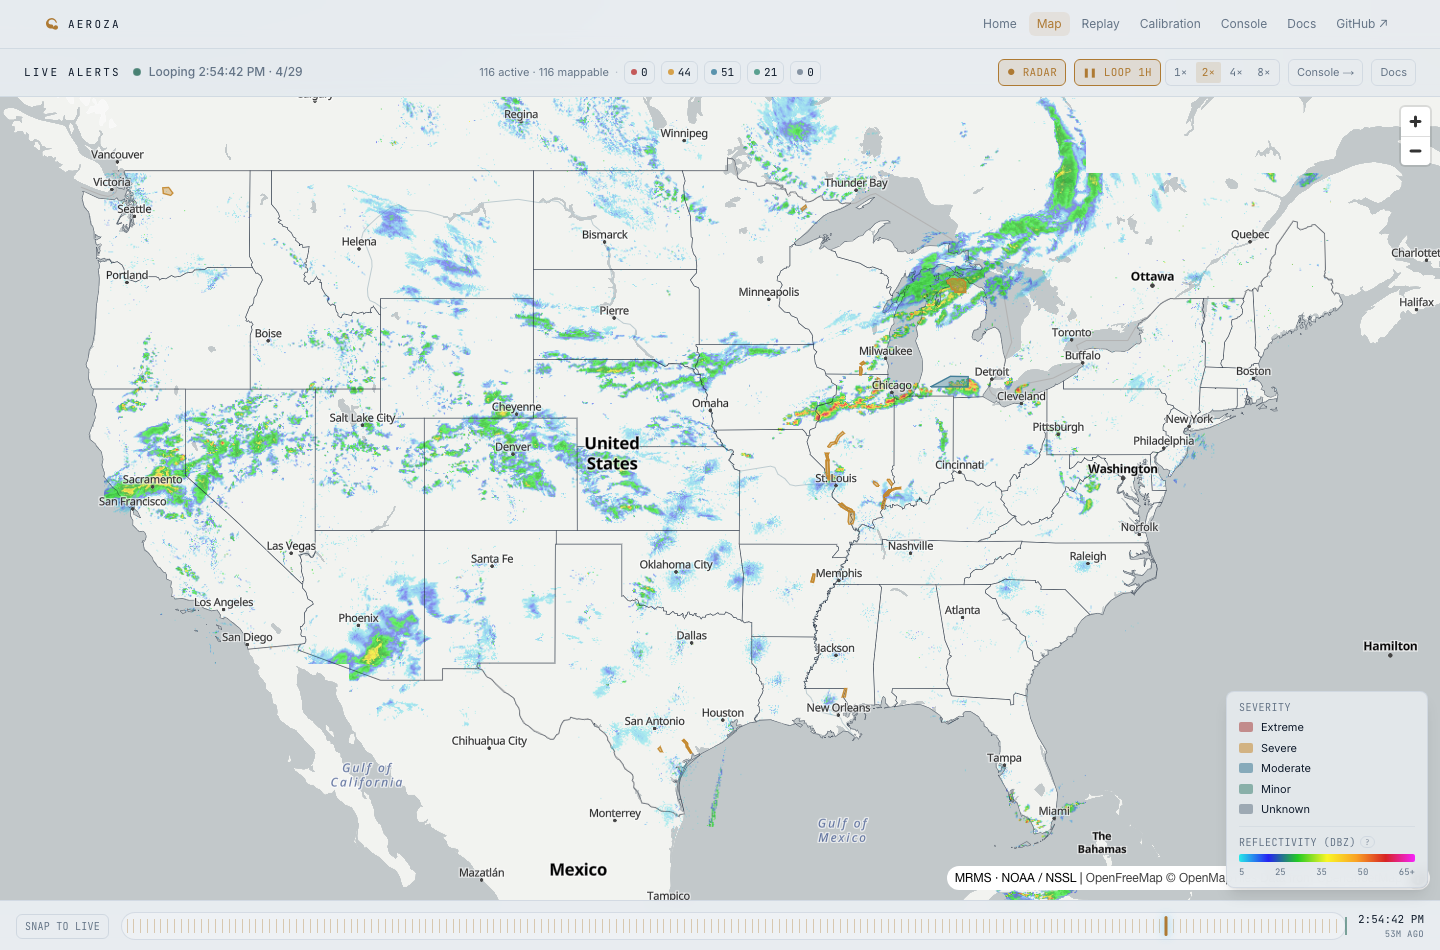
The map is the emotional center of the thing because radar is still the fastest way for me to understand weather as a moving object. But the map is not the whole product. It is the visible layer over the data plane: MRMS reflectivity grids, NWS alerts, tiles, alert counts, timestamps, and query surfaces.
The main API surfaces include:
- NWS alerts, including streaming updates.
- MRMS radar files, grids, samples, polygons, and map tiles.
- METAR surface observations.
- Nowcasts at short horizons.
- Calibration and verification endpoints.
- Webhooks and alert rules.
The thing I care about most is that the data is meant to be used programmatically. You can ask for a point sample. You can reduce over a polygon. You can draw tiles. You can subscribe to weather events. You can score forecasts against what actually happened.
That last bit matters.
Forecasts should be accountable
Weather is probabilistic, but most weather products hide the scoreboard.
Aeroza is built around the opposite instinct. If it predicts reflectivity 10, 30, or 60 minutes out, that prediction should be compared with the matching observation when reality arrives. The public calibration surface is meant to make the model behavior visible: MAE, bias, RMSE, categorical scores, and probabilistic scores as the system grows.
This is where the stats part of my brain gets happy.
It is easy to make a forecast image look impressive. It is harder, and much more useful, to keep a running ledger of whether the forecast was right. The gap between those two things is where a lot of interesting engineering lives: aligning grids in time, weighting samples correctly, choosing metrics that mean something, and making sure “better” is not just a vibe.
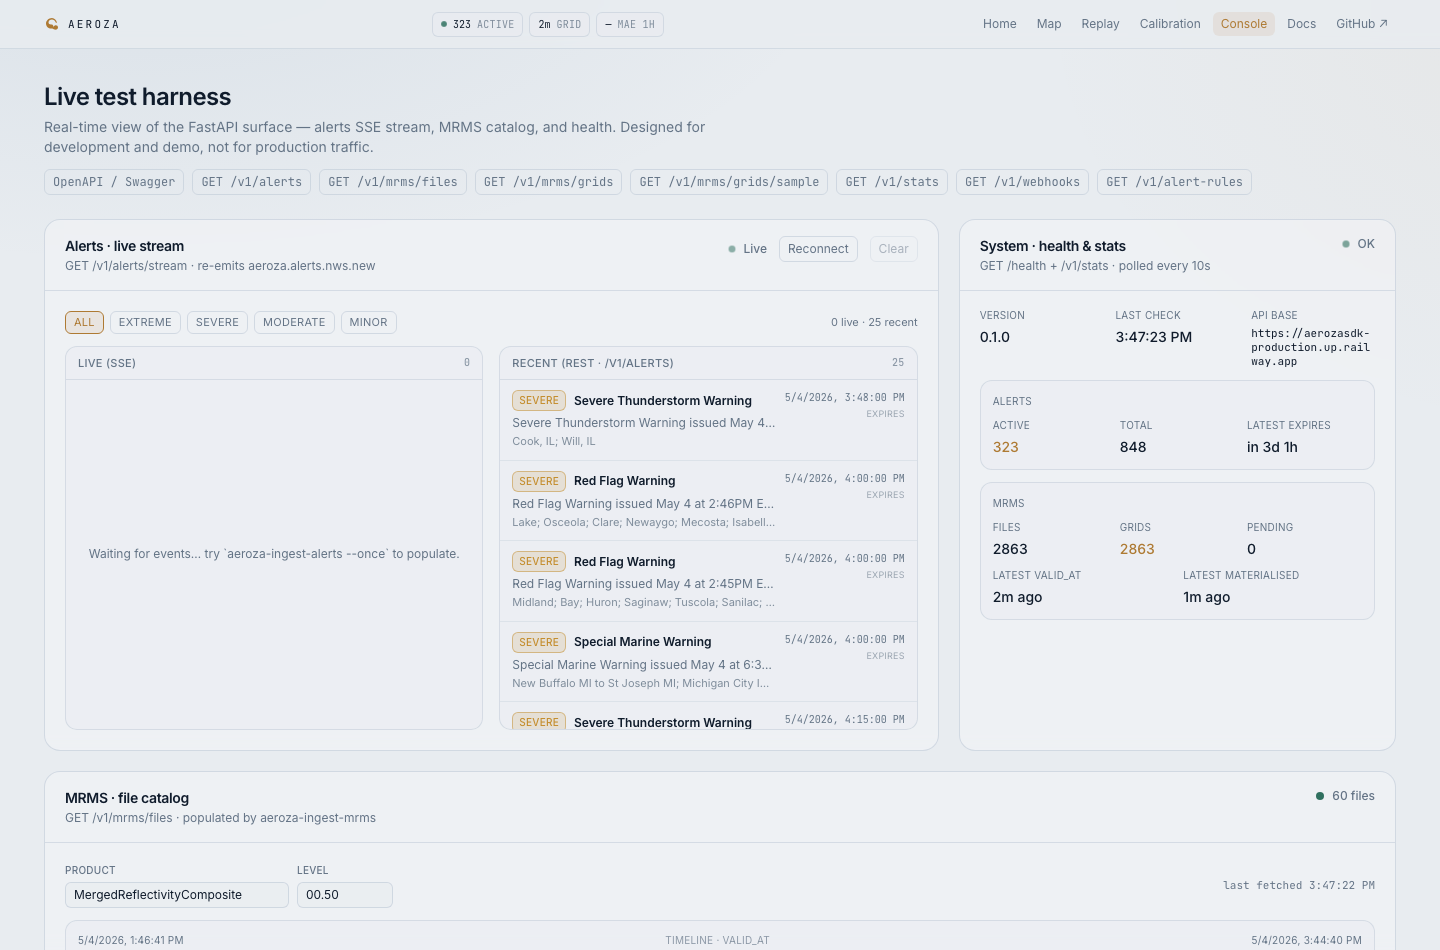
The console is the product spec
The dev console is where Aeroza becomes less abstract. It runs the public endpoints in one place: alerts, MRMS files, grids, health, stats, and more. I like this style of product because it forces the API to be honest. If the console cannot explain the system by using the same routes a developer would use, the API probably needs work.
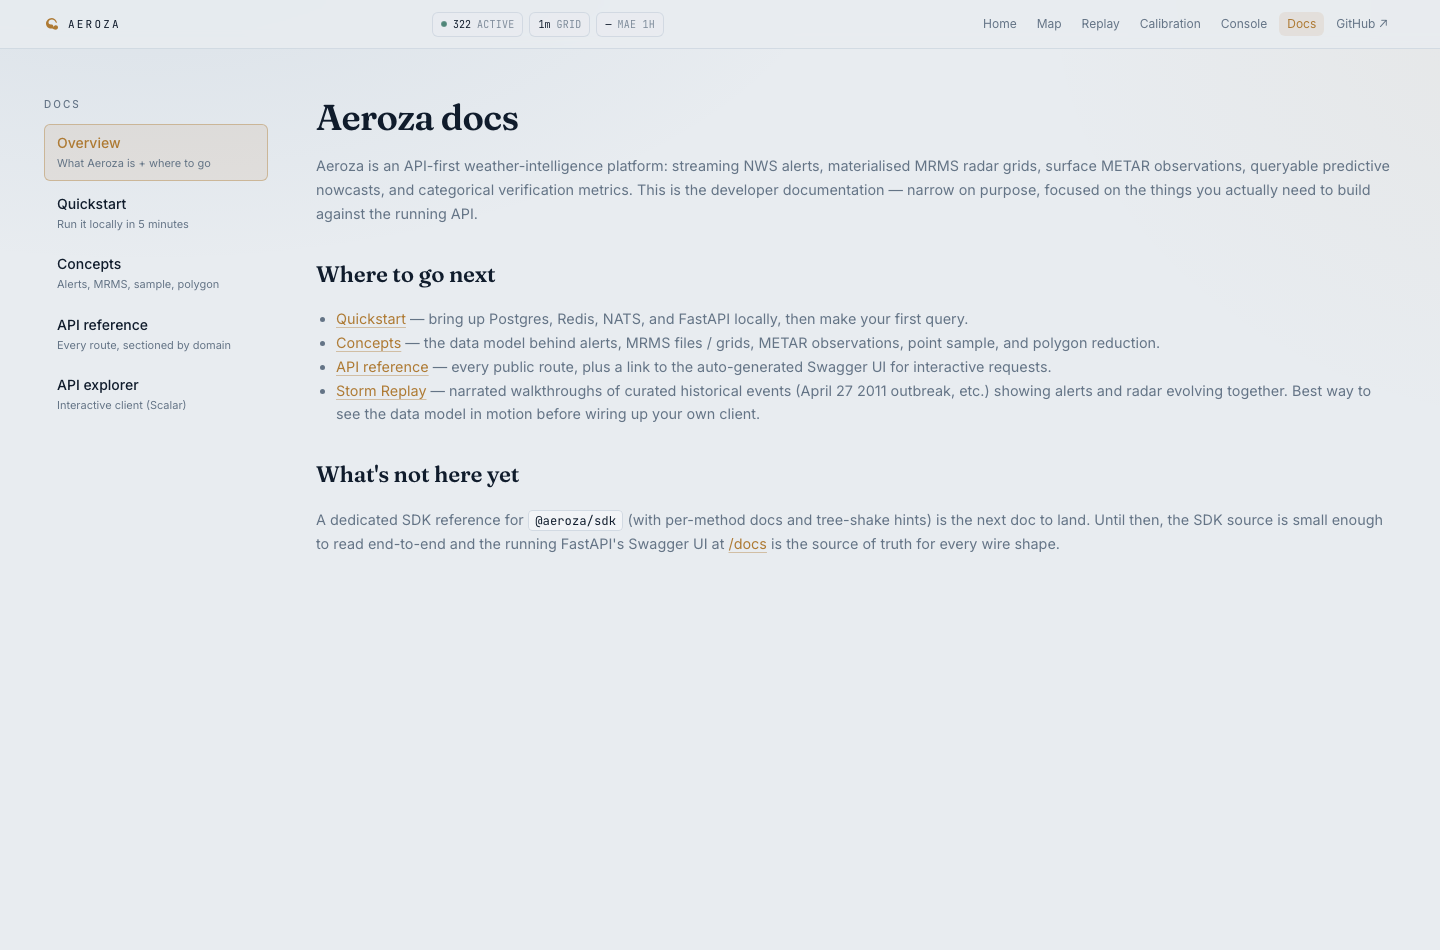
The docs are similarly narrow on purpose. Quickstart, concepts, API reference, API explorer. The goal is not to write a weather textbook. The goal is to make the surface area discoverable enough that someone can build against it without reverse-engineering the app.
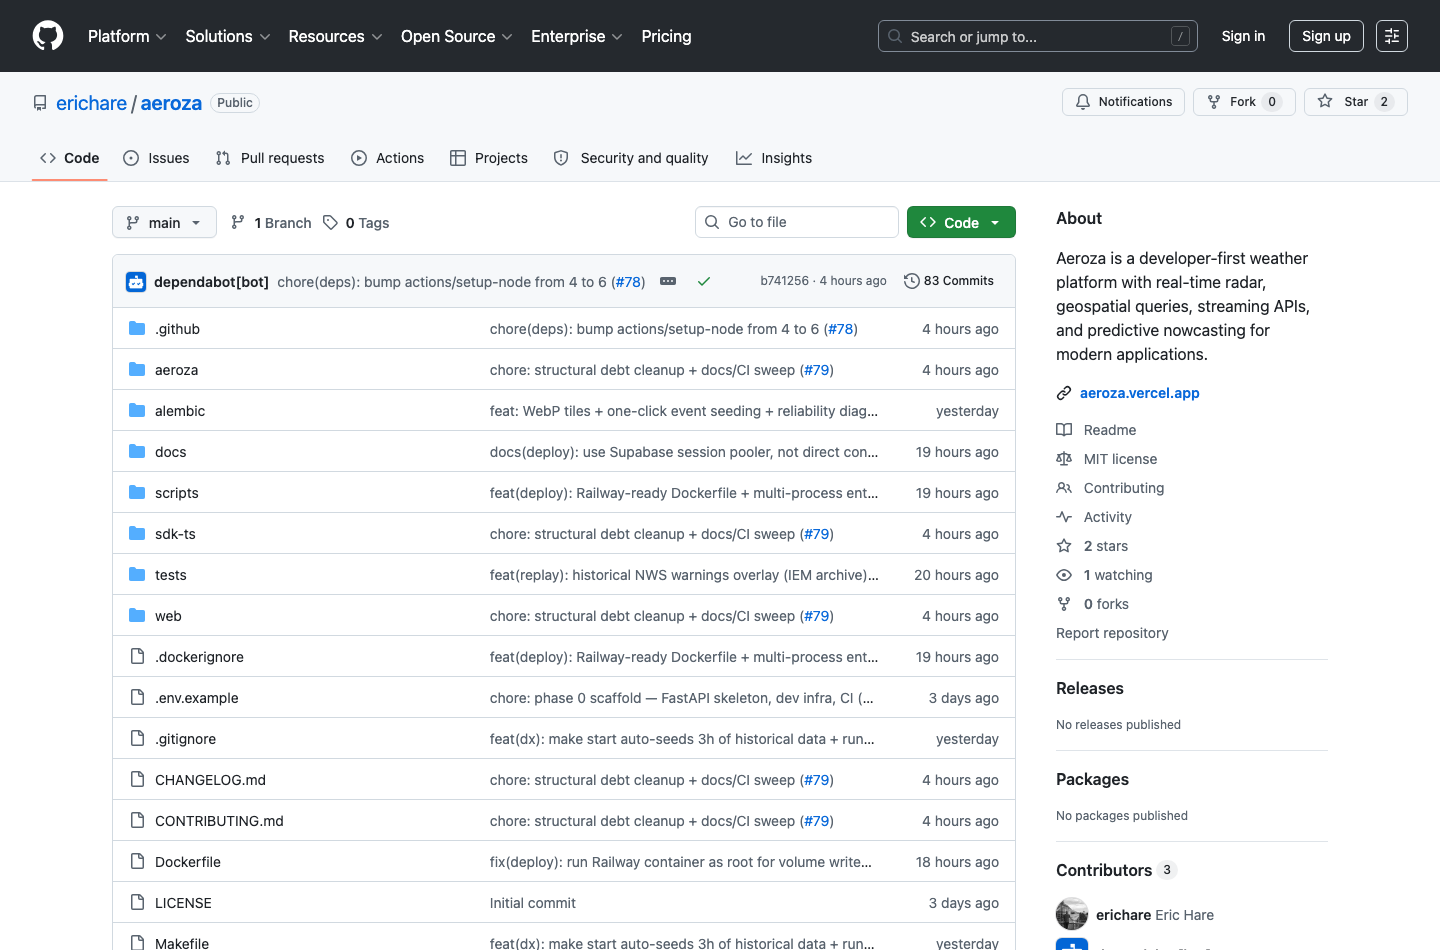
The repo
Aeroza is open source at github.com/erichare/aeroza.
The repo is mostly Python and TypeScript. The backend is a FastAPI modular monolith with extracted workers for ingest, materialization, nowcasting, verification, streams, and webhooks. The web surface is Next.js. Storage and streaming are the kind of stack you would expect for this problem: Postgres with PostGIS, Redis, NATS JetStream, and Zarr/S3-style raster storage.
The quickstart is:
make startThat brings up the local stack, including the API, console, workers, and supporting services. The TypeScript SDK lives in the repo too, and the web console uses it directly. I like that because it keeps the SDK close to the real product surface instead of letting it drift into aspirational docs.
There is still plenty to do: stronger ensemble nowcasting, reliability diagrams, more ingest sources, rate limiting, and deeper SDK docs. But the core shape is there now: live weather data, queryable geometry, short-horizon predictions, and a verification loop.
A very old habit, upgraded
Part of the fun of Aeroza is that it feels like a straight line from that elementary-school talent show to now.
The second-grade version of me wanted to stand up and tell people what the weather was going to do. The adult version wants to give software the same ability, but with better data structures, public metrics, and fewer construction-paper visual aids.
Weather is still the same strange mix of physical system, uncertainty, urgency, and pattern recognition. It is still worth watching closely. Aeroza is my attempt to make that watching programmable.
Try it here: aeroza.vercel.app.
Source here: github.com/erichare/aeroza.